One year ago, the 26th of April 2012, during the Land and Poverty Conference organised in Washington by World Bank, the Land Matrix partnership launched the online database “Land Matrix” [http://www.landportal.info/landmatrix]. The main purpose was to encourage researchers, governments, citizens and companies to provide more data on land acquisitions. The database “records transactions that entail a transfer of rights to use, control or own land through sale, lease or concession; that cover 200 hectares (ha) or more, and that have been concluded since the year 2000” (Answeuw et al 2012) [http://landportal.info/landmatrix/media/img/analytical-report.pdf].
Today this platform, developed as a crowdsourcing tool, established itself as the most extensive collection of informations about the phenomenon of large-scale land acquisitions. At the launching day, the online public database documented 1,006 deals since the year 2000 amounting to 70,217,083 ha of land. But surprisingly, instead of increasing, as it could be expected, the numbers decreased and one year later the database documented 924 deals amounting to merely 48,829,193 ha of land. In this blog entry I would like to discuss very roughly changes regarding African and Asian data. All figures presented here refer to the open-access data from the Land Matrix.
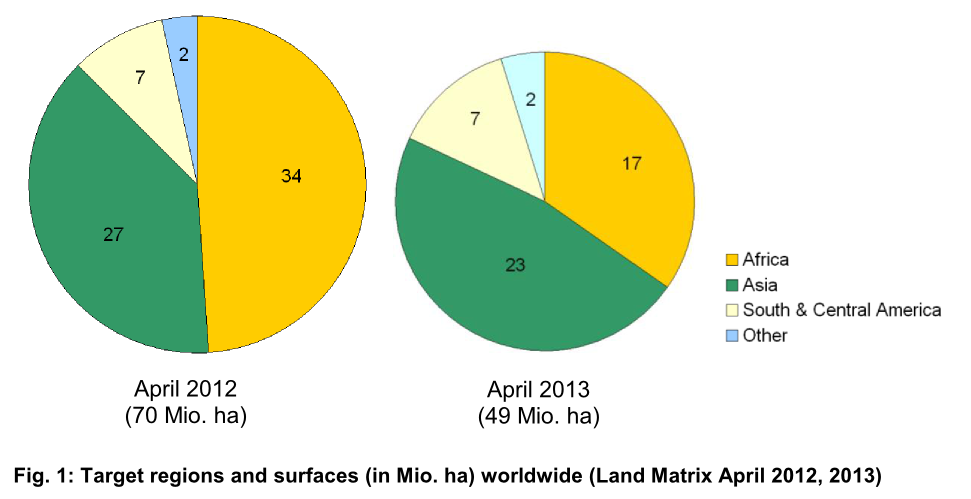
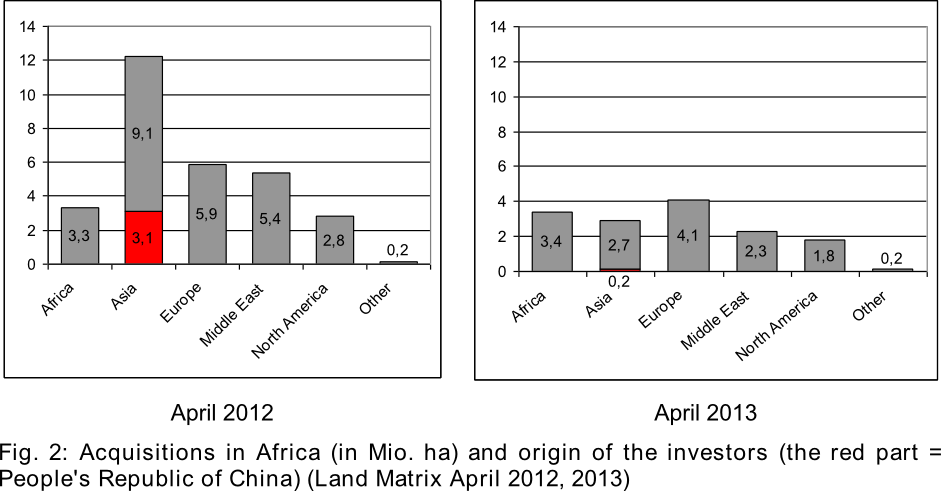
Between April 2012 and April 2013 the total land acquisitions in Africa dropped by 50% from 34 to 17 million ha and Asia displaced Africa as the most targeted region worldwide (fig. 1). Over the same period of time Asian investments in Africa decreased from 9.1 to 2.7 million ha and Chinese acquisitions even from 3.1 to 0.2 million ha (fig. 2). The Land Matrix mentions no African investments in Asia.
How can these major changes in the Land Matrix database be explained? The database ranks data reliability on a scale from 0 (worst) to 3 (best). The term “reported” refers to all cases and the term “reliable” to the data ranked 1, 2 or 3. Only reliable data are open access. In their analytical report the authors point out two effects affecting the reliability: the “media bias” and the “different levels of transparency” (Anseuw et al. 2012: 16) [http://landportal.info/landmatrix/media/img/analytical-report.pdf]. Furthermore they indicate that as “the database matures, cases will be revised in terms of their reliability” (Anseuw et al. 2012: 16) [http://landportal.info/landmatrix/media/img/analytical-report.pdf] and invite the users to inform them about errors. This happened immediately after the launching of the Land Matrix especially for several cases of supposed Chinese investments in Africa (for instance Petrus Brenner on April 27 [http://farmlandgrab.org/post/view/20405] or Deborah Brautigam on April 30 [http://www.chinaafricarealstory.com/2012/04/zombie-chinese-land-grabs-in-africa.html]). After those critics, the Land Matrix partnership removed amongst others one investment in the Democratic Republic of Congo, that alone accounted for 2,800,000 ha.
Because most data in the Land Matrix rely on media reports, changes occurred since the launching are mainly due to the correction of the aforementioned “media bias”. Media – but also sciences – tend to see Asia as a threat and Africa as a victim. This explains why in April 2012 Africa was seen as the worldwide most targeted region and Asia as the main origin region of the land acquisitions in Africa. The situation changed dramatically since then and in April 2013 Asia seems to be the worldwide most targeted region and Europe the most active investing region in Africa.


